Iceland, Institutional
Change


The views expressed are those of the teams comprising Wellington’s Impact Platform including our impact equity and fixed income investment teams and IMM Practice. For these teams and strategies, impact measurement and management and engagement is a core component of the investment process. These practices do not necessarily extend to other strategies that Wellington Management offers. Views are those of the authors at the time of writing, and other teams may hold different views and make different investment decisions. The value of your investment may become worth more or less than at the time of original investment. While any third-party data used is considered reliable, its accuracy is not guaranteed. For professional, institutional, or accredited investors only.
Impact Investing Platform
Impact Investing Platform
2025 Impact highlights
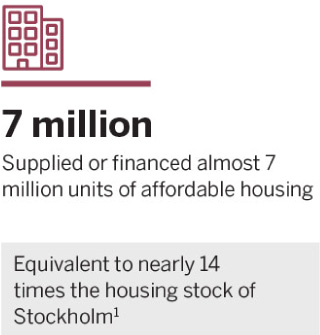
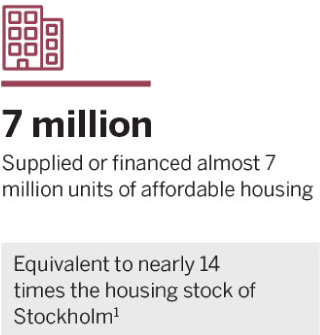
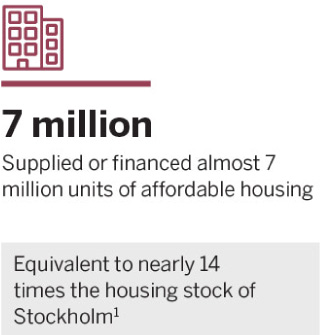
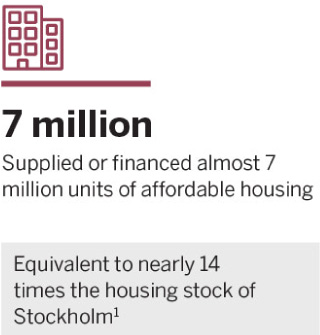
Investments in our equity and fixed income portfolios have enabled companies and other issuers to achieve the following impact:
-
Global Impact
-
Global Impact Bond
Global Impact









Note: 49% of our holdings (as a percentage of market value) leverage a common KPI that can be aggregated. If a company or issuer does not report a figure that we believe aligns with one of our aggregated KPIs, we still monitor and report the Individualized KPI over time, but do not include it in the above aggregated statistics which we believe provide a conservative estimate of the impact our funds enable. All reported impact KPIs are obtained from publicly available information. We do not account for fund ownership stakes in the above calculations which represent 100% of the impact of the companies or issuers in which we invest. For each aggregated KPI we provide what we believe to be a relevant reference point. These are for context only and do not imply any equivalence for our KPIs regarding benefits delivered for society and the environment. | If 2025 data is not yet available, 2024 data has been used. Aggregated KPIs reflect the impact of the portfolio as of 31 December 2025. These data points do not constitute a data series and should not be compared to aggregated data points published in previous years due to changes in the portfolio holdings between each publication date. | All investing involves risk. Investors should consider the risk to their capital, before investing. These impact highlights relate to the representative accounts for our equity strategies, and are for informational purposes only, are subject to change, and are not indicative of future portfolio characteristics or returns. The value of your investment may become worth more or less than at the time of original investment. Please refer to the Important disclosures on our website or at the end of this document for more information.
1“Number of dwellings by region and type of building (including special housing). Year 2013 – 2025,” Statistical Database, Official Statistics of Sweden. | 2“How much water does an Olympic-sized swimming pool hold?,” Portrait Pools. | 3“Admitted patient care,” Australian Institute of Health and Welfare, (2024 – 2025 figures). | 4“Africa population,” WorldOMeter, accessed 24 March 2026. | 5 “Higher education student numbers,” House of Commons Library, 20 February 2026. | 6“The Global Findex Database 2024,” The World Bank. | 7 “2025 Data Breach Report,” Identity Theft Resource Center (ITRC). (The aggregated KPI should not be directly compared to the number of data breaches and people impacted. Instead, it should be used as an indication of scale.) | 8“Greenhouse Gas Equivalencies Calculator,” United States Environmental Protection Agency (data from 2023). | 9“Greenhouse Gas Equivalencies Calculator,” United States Environmental Protection Agency (data from 2022). | *Unless otherwise indicated, we use tonnes for metric tons throughout this report.
Global Impact Bond









Note: 47% of our holdings (as a percentage of market value) leverage a common KPI that can be aggregated. If a company or issuer does not report a figure that we believe aligns with one of our aggregated KPIs, we still monitor and report the Individualized KPI over time, but do not include it in the above aggregated statistics which we believe provide a conservative estimate of the impact our funds enable. All reported impact KPIs are obtained from publicly available information. We do not account for strategies ownership stakes in the above calculations which represent 100% of the impact of the companies or issuers in which we invest. For each aggregated KPI we provide what we believe to be a relevant reference point. These are for context only and do not imply any equivalence for our KPIs regarding benefits delivered for society and the environment. | If 2025 data is not yet available, 2024 data has been used. Aggregated KPIs reflect the impact of the portfolio as of 31 December 2025. These data points do not constitute a data series and should not be compared to aggregated data points published in previous years due to changes in the portfolio holdings between each publication date. | All investing involves risk. Investors should consider the risk to their capital, before investing. These impact highlights relate to the representative accounts for our fixed income strategies, and are for informational purposes only, are subject to change, and are not indicative of future portfolio characteristics or returns. The value of your investment may become worth more or less than at the time of original investment. Please refer to the Important disclosures on our website or at the end of this document for more information.
1“Number of dwellings by region and type of building (including special housing). Year 2013 – 2025,” Statistical Database, Official Statistics of Sweden. | 2“How much water does an Olympic-sized swimming pool hold?,” Portrait Pools. | 3“Admitted patient care,” Australian Institute of Health and Welfare, (2024 – 2025 figures). | 4“Africa population,” WorldOMeter, accessed 24 March 2026. | 5“Higher education student numbers,” House of Commons Library, 20 February 2026. | 6“The Global Findex Database 2024,” The World Bank. | 7“2025 Data Breach Report,” Identity Theft Resource Center (ITRC). (The aggregated KPI should not be directly compared to the number of data breaches and people impacted. Instead, it should be used as an indication of scale.) | 8“Greenhouse Gas Equivalencies Calculator,” United States Environmental Protection Agency (data from 2023). | 9“Greenhouse Gas Equivalencies Calculator,” United States Environmental Protection Agency (data from 2022). | *Unless otherwise indicated, we use tonnes for metric tons throughout this report.
Impact reports
See impact highlights from each of our strategies, along with measurable impact results from the companies and issuers in which we invest.
IMPACT INVESTING AT WELLINGTON
Approach to engagement