




-
-
19
-
offices around the world
-
FEATURED EQUITY FUNDS
FEATURED FIXED INCOME FUNDS
Asset classes

FEATURED EQUITY FUNDS
FEATURED FIXED INCOME FUNDS
Asset classes

Asia Asset Management
Best of the Best Awards 2025
Fund Launch of the Year —
Hong Kong SAR & Singapore 1

AsianInvestor
Asset Management Awards 2026
Asset Class Awards —
Asian Fixed Income, US Dollar 2

AsianInvestor
Wealth Awards 2026
Asset Class Awards —
Asian Fixed Income 2

Asian Private Banker
Asset Management Awards
for Excellence 2026
Best Fund Provider — Hedge Funds 3

Asian Private Banker
Asset Management Awards
for Excellence 2026
Best Fund Provider — Global Equity 3

Asian Private Banker
Asset Management Awards
for Excellence 2026
Highly Commended Fund Provider —
US Equity 3

Asian Private Banker
Asset Management Awards
for Excellence 2025
Highly Commended —
US Equity 3

Asian Private Banker
Asset Management Awards
for Excellence 2025
Best New Fund — Bond 3
Fund Selector Asia
House Awards Hong Kong 2026
Equity House of the Year 4
Fund Selector Asia
House Awards Hong Kong 2025
Excellence in Innovation 4
Fund Selector Asia
Awards Singapore 2023
Excellence in Innovation 4
Asia Asset Management
Best of the Best Awards 2025
Fund Launch of the Year —
Hong Kong SAR & Singapore 1
AsianInvestor
Asset Management Awards 2026
Asset Class Awards —
Asian Fixed Income, US Dollar 2
AsianInvestor
Wealth Awards 2026
Asset Class Awards —
Asian Fixed Income 2
Asian Private Banker
Asset Management Awards
for Excellence 2026
Best Fund Provider — Hedge Funds 3
Asian Private Banker
Asset Management Awards
for Excellence 2026
Best Fund Provider — Global Equity 3
Asian Private Banker
Asset Management Awards
for Excellence 2026
Highly Commended Fund Provider —
US Equity 3
Asian Private Banker
Asset Management Awards
for Excellence 2025
Highly Commended —
US Equity 3
Asian Private Banker
Asset Management Awards
for Excellence 2025
Best New Fund — Bond 3
Fund Selector Asia
House Awards Hong Kong 2026
Equity House of the Year 4
Fund Selector Asia
House Awards Hong Kong 2025
Excellence in Innovation 4
Fund Selector Asia
Awards Singapore 2023
Excellence in Innovation 4
Past performance is no guarantee of future results.
1. Asia Asset Management Best of the Best Awards: Issued by Asia Asset Management, 2025 awards, reflecting performance over the past year up to 30/11/2024.
2. AsianInvestor Asset Management Awards and AsianInvestor Wealth Awards: Issued by AsianInvestor and AsianInvestor Wealth respectively, 2026 awards, reflecting performance from October 2024 to September 2025.
3. Asian Private Banker Asset Management Awards for Excellence: Issued by Asian Private Banker in the year specified. 2025 awards reflect performance from end-August 2023 to early September 2024. 2026 awards reflect performance from end-July 2024 to early August 2025.
4. Fund Selector Asia House Awards Hong Kong/Fund Selector Asia Awards Singapore: Issued by Fund Selector Asia in the year specified, reflecting performance during the previous calendar year.
Why Wellington
Wellington Management is one of the world’s leading independent asset managers. Since our foundation in 1928, we have expanded from our headquarters in Boston to the main international and Asian financial centres, providing clients with local knowledge and global expertise.
USD 1.3 T+
client assets under management
19
offices around the world
3,000+
Number of clients
60+
client locations by country/region
800+
investment professionals
All figures are for the Wellington Management Group of companies as of 30 June 2026.
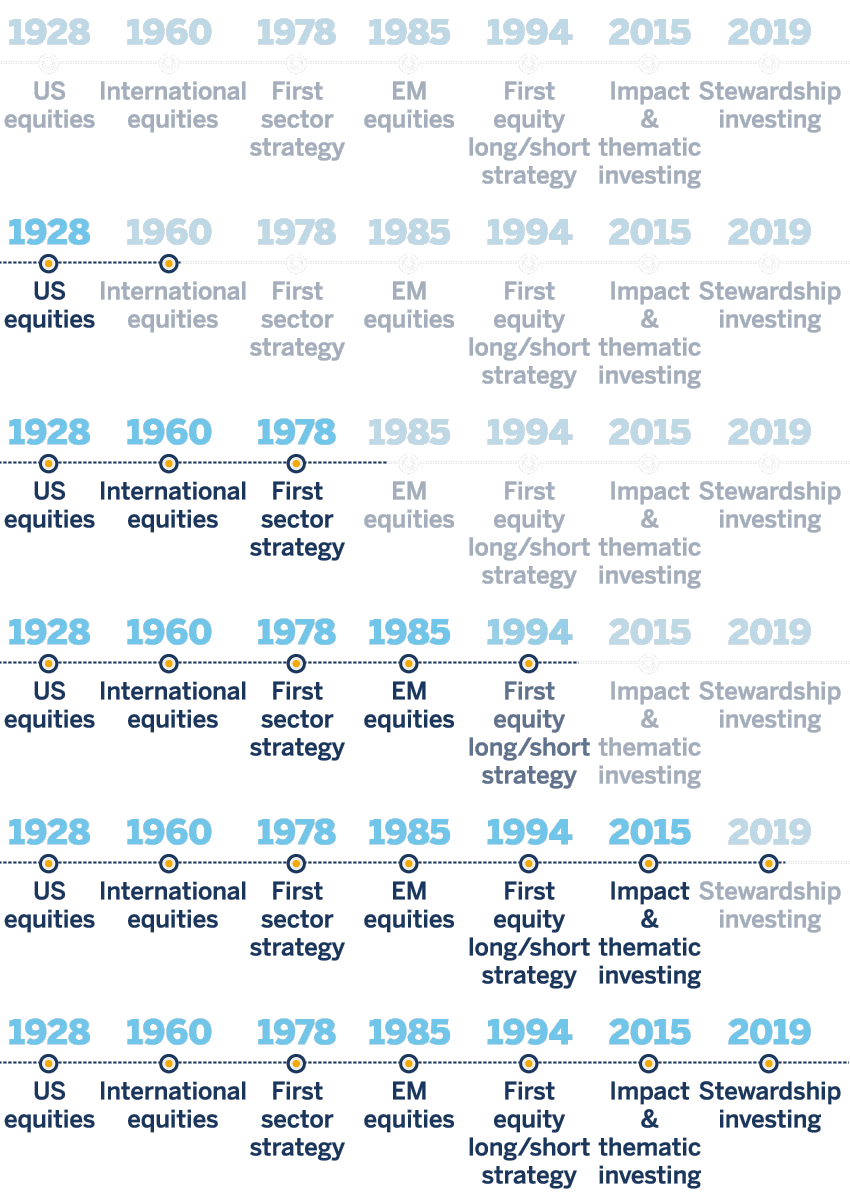
Over 95 years in active equity investing
With a history of active equity investing that dates back nearly a century, first in Boston, and now globally, we believe our deep research and unique perspectives can help elevate your investments and unlock value in today’s markets.
USD 625B+
equity assets managed globally (USD)
300+
equity investment professionals
19
average years of investing experience
All figures are for the Wellington Management Group of companies as at 31 December 2023.
USD 625B+
equity assets managed globally (USD)
300+
equity investment professionals
19
average years of investing experience
All figures are for the Wellington Management Group of companies as of 30 June 2026.
USD 1.3 T
Client assets managed
800+
Investment professionals
3,000+
Clients
60+
Client locations by country/region
All figures are for the Wellington Management Group of companies as at 31 December 2023.
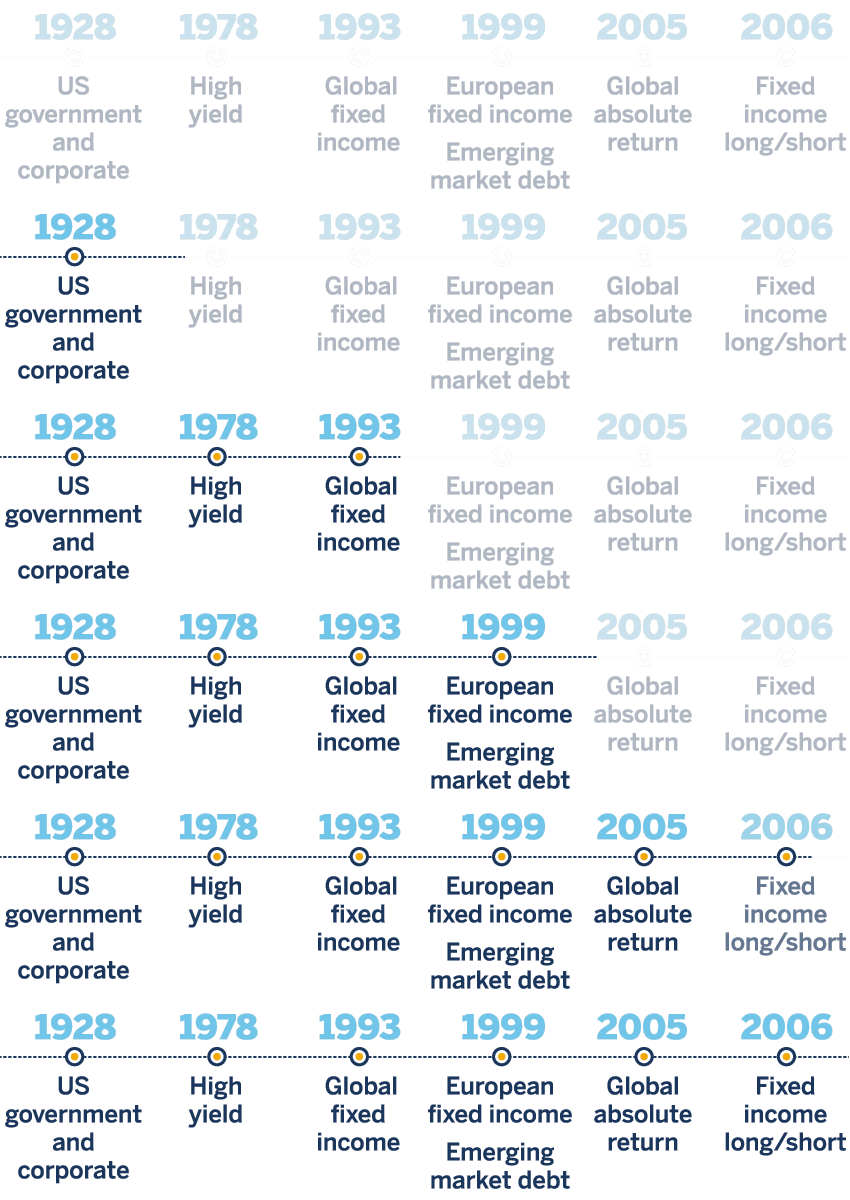
Over 95 years in active fixed income investing
With a history of active fixed income investing that dates back nearly a century, first in Boston and now globally, we believe our deep research and unique perspectives can help elevate your investments and unlock value in today’s markets.
USD 500 B+
Fixed income assets managed firmwide
275+
Fixed income investment professionals
17
Average years' experience
All figures are for the Wellington Management Group of companies as at 31 December 2025.
USD 500 B+
Fixed income assets managed firmwide
275+
Fixed income investment professionals
17
Average years' experience
All figures are for the Wellington Management Group of companies as of 30 June 2026.
2026 Midyear Outlook

Three priorities for investors in a less predictable world
Despite adverse headlines and events, risk markets have remained constructive this year, but the rally has become increasingly dependent on a limited set of market leaders. How robust can markets be when so much depends on momentum continuing unchecked?
URL References
Related Insights
Latest insights
Past results are not necessarily indicative of future results and an investment can lose value. Funds returns are shown net of fees. Source: Wellington Management
© 2026 Morningstar, Inc. All Rights Reserved. The information contained herein: (1) is proprietary to Morningstar; (2) may not be copied or distributed; and (3) is not warranted to be accurate, complete or timely. Neither Morningstar nor its content providers are responsible for any damages or losses arising from any use of this information. The Overall Morningstar Rating for a fund is derived from a weighted average of the three, five, and ten year (if applicable) ratings, based on risk-adjusted return. Past performance is no guarantee of future results.
The content within this page is issued by Wellington Management Singapore Pte Ltd (UEN: 201415544E) (WMS). This advertisement or publication has not been reviewed by the Monetary Authority of Singapore. Information contained on this website is provided for information purposes and does not constitute financial advice or recommendation in any security including but not limited to, share in the funds and is prepared without regard to the specific objectives, financial situation or needs of any particular person.
Investment in the funds described on this website carries a substantial degree of risk and places an investor’s capital at risk. The price and value of investments is not guaranteed. The value of the shares of the funds and the income accruing to them, if any, and may fall or rise. An investor may not get back the original amount invested and an investor may lose all of their investment. Investment in the funds described on this website is not suitable for all investors. Investors should read the prospectus and the Product Highlights Sheet of the respective fund and seek financial advice before deciding whether to purchase shares in any fund. Past performance or any economic trends or forecast, are not necessarily indicative of future performance. Some of the funds described on this website may use or invest in financial derivative instruments for portfolio management and hedging purposes. Investments in the funds are subject to investment risks, including the possible loss of the principal amount invested. None of the funds listed on this website guarantees distributions and distributions may fluctuate and may be paid out of capital. Past distributions are not necessarily indicative of future trends, which may be lower. Please note that payment of distributions out of capital effectively amounts to a return or withdrawal of the principal amount invested or of net capital gains attributable to that principal amount. Actual distribution of income, net capital gains and/or capital will be at the manager’s absolute discretion. Payments on dividends may result in a reduction of NAV per share of the funds. The preceding paragraph is only applicable if the fund intends to pay dividends/ distributions. Performance with preliminary charge (sales charge) is calculated on a NAV to NAV basis, net of 5% preliminary charge (initial sales charge). Unless stated otherwise data is as at previous month end.
Subscriptions may only be made on the basis of the latest prospectus and Product Highlights Sheet, and they can be obtained from WMS or fund distributors upon request.
This material may not be reproduced or distributed, in whole or in part, without the express written consent of Wellington Management.